How to View VPS Graphs on Sive.Host Client Area
Why VPS Graphs Matter
VPS graphs provide essential insights to help you manage, secure, and optimize your server:
- Performance Monitoring
▸ Track real-time and historical usage of CPU, RAM, disk I/O, and network bandwidth.
▸ Spot performance bottlenecks or abnormal spikes. - Troubleshooting
▸ Investigate slowdowns, downtime, or crashes by linking them to resource surges. - Resource Management
▸ See how your VPS uses resources and whether it's under- or over-utilized.
▸ Make informed decisions about scaling or optimizing. - Security Monitoring
▸ Detect unusual CPU or network activity that may signal abuse, malware, or attacks. - Historical Tracking
▸ Analyze usage trends over time or after configuration changes. - Cost Optimization
▸ Avoid overpaying for resources you don’t need by monitoring actual usage.
Steps to View VPS Graphs
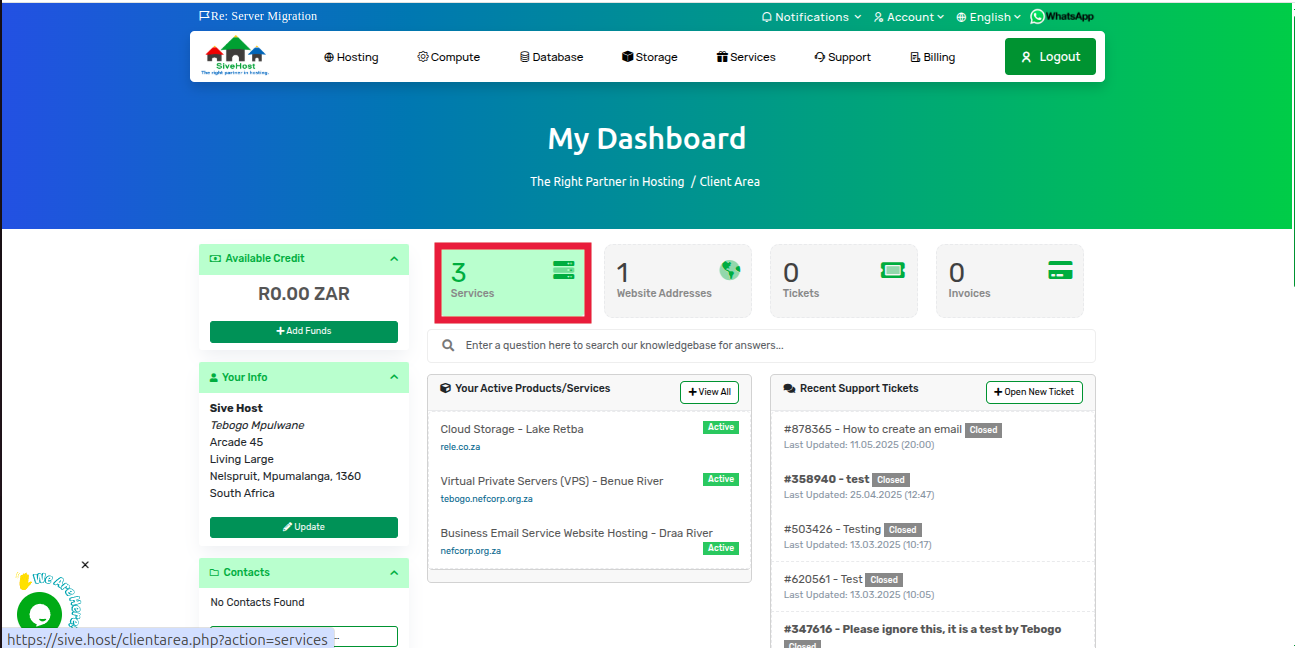
1. Log in to your Sive.Host client area.
2. On your dashboard, click “Services” to view all your products.
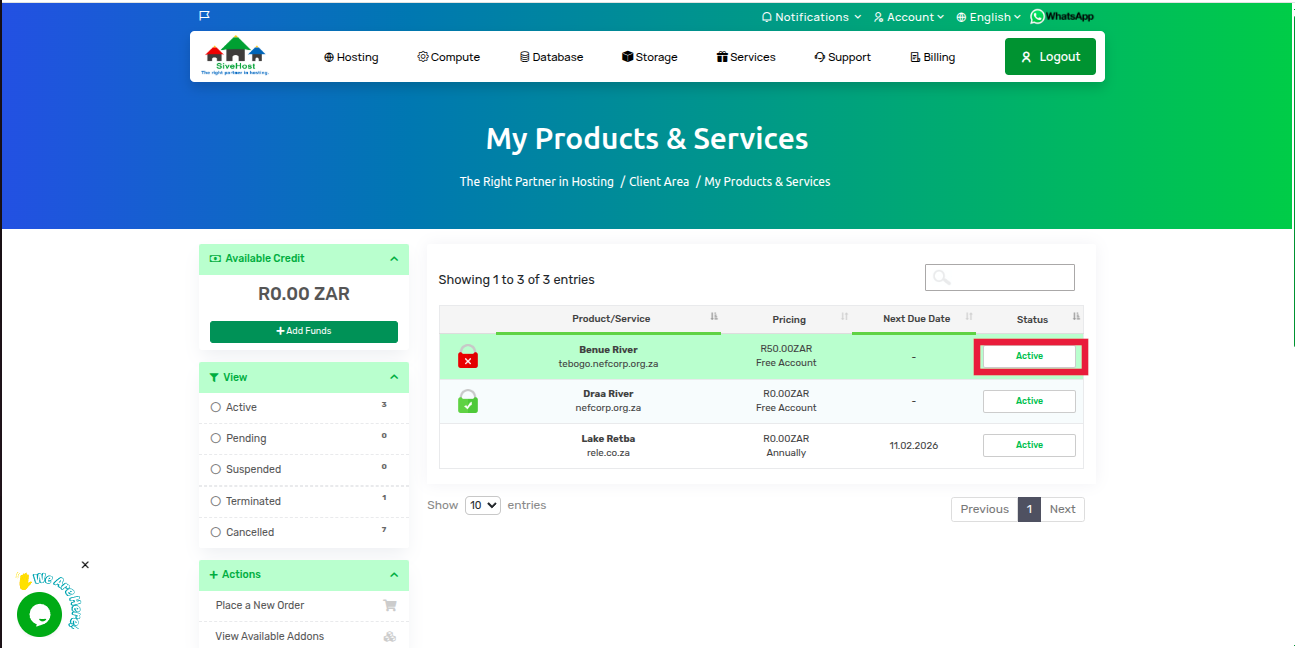
3. Find the VPS you want to check and click “Active” under its status.
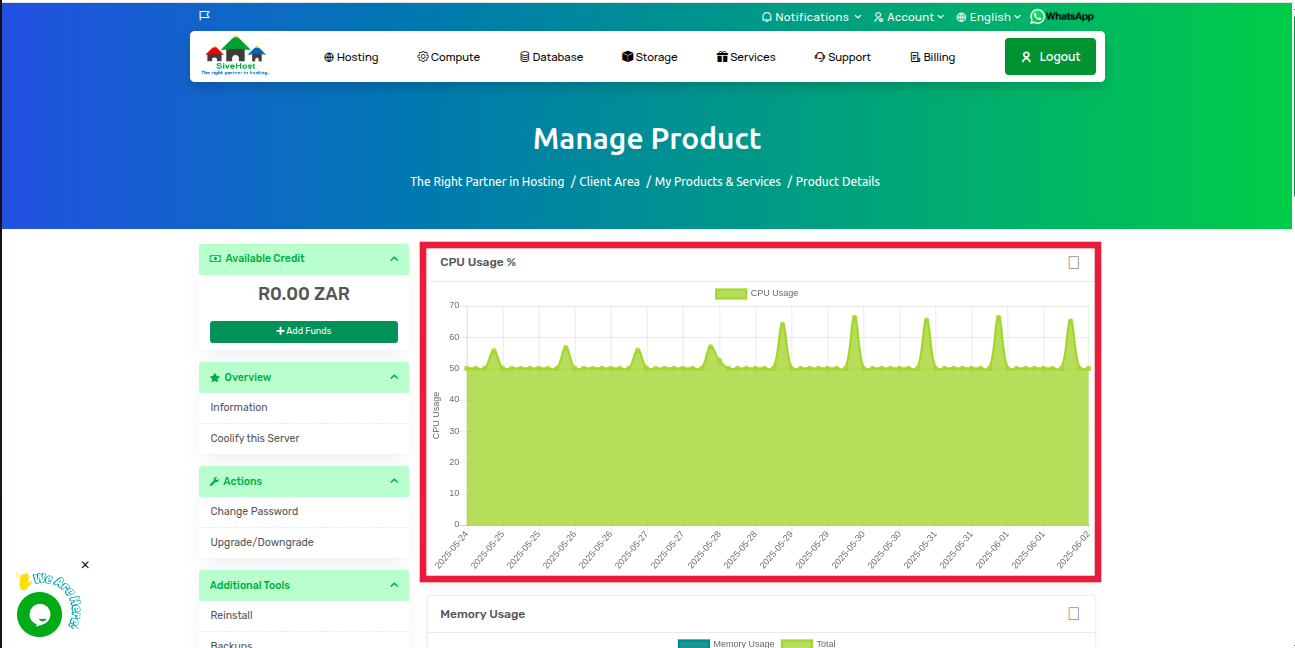
4. On the Server Product Page, select “Graphs” from the left-hand menu under Additional Tools.
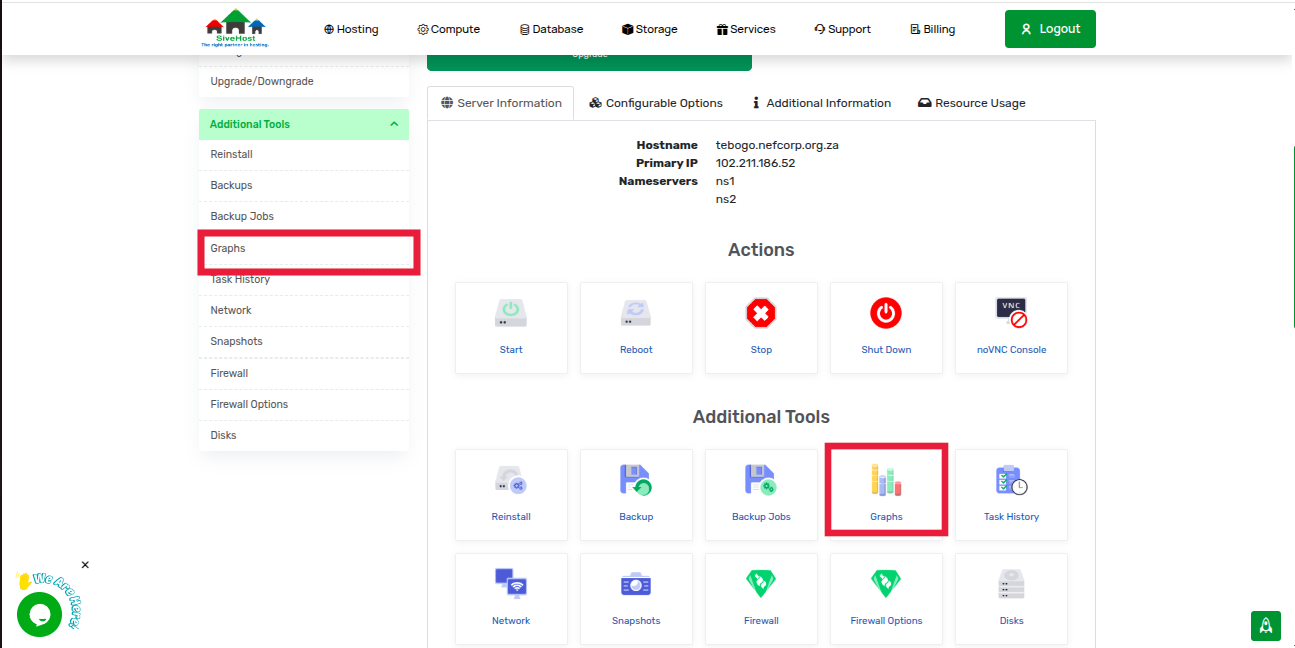
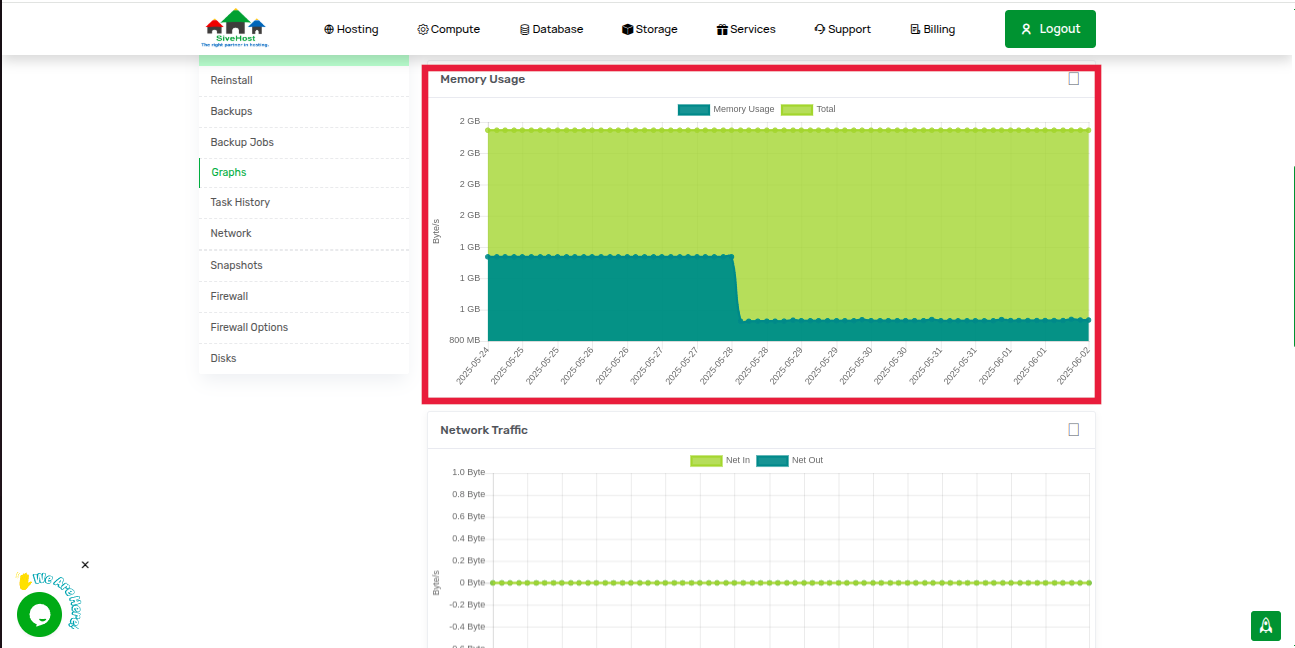
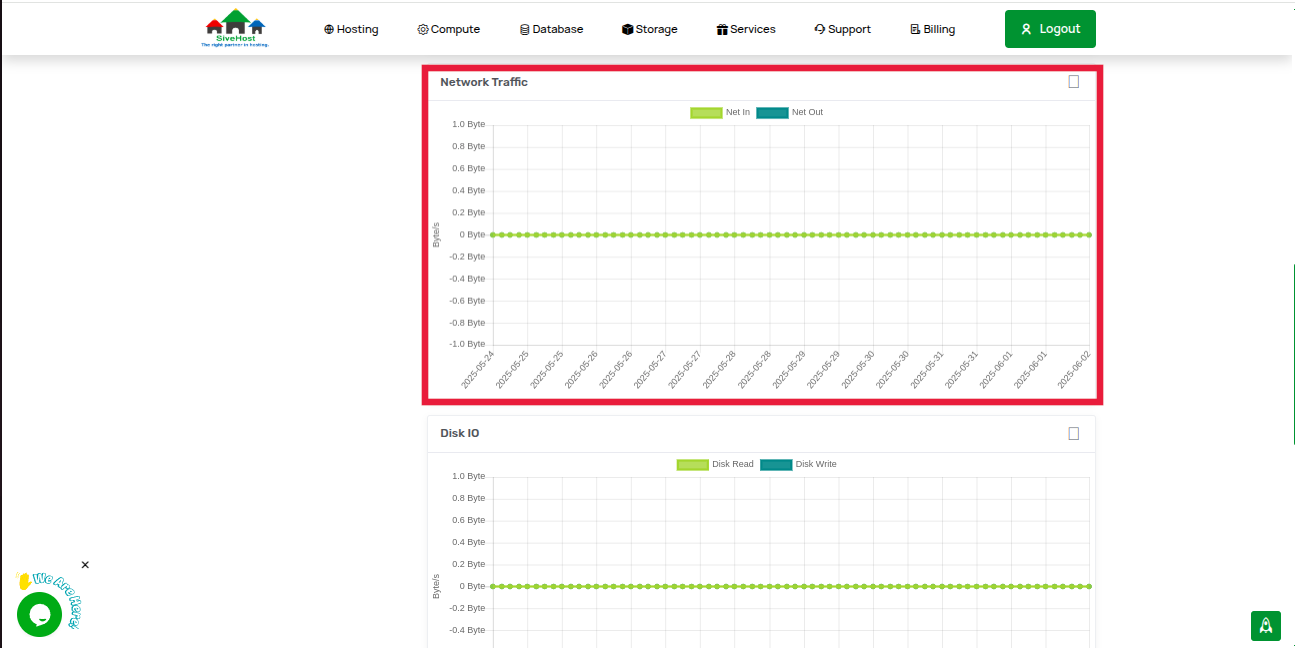
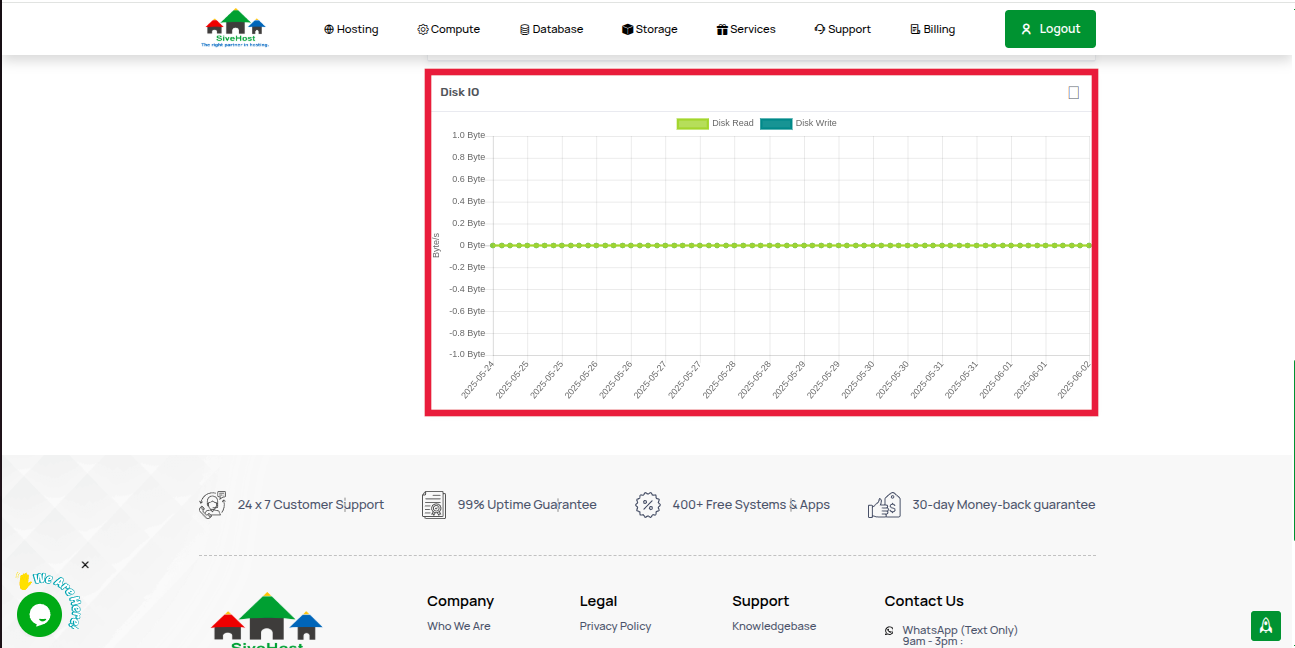
5. View your resource usage graphs — CPU, Memory, Disk IO, and Network traffic.